Running a pipeline in RoboSherlock
This tutoial assumes that you have followed the tutorial on creating a new robosherlock package.
It introduces users to the components of the framework, and how to use them. Download the provided sample bag file. If you are following the docker tutorial you will find the bagfile in ~/data/ folder. The bagfile was recorded using a PR2 robot and contains a short stream of kinect data, namely the topics (check with rosbag info):
/kinect_head/rgb/image_color/compressed
/kinect_head/depth_registered/comressedDepth
/kinect_head/rgb/camera_info
/tf
Tf is needed to get the transformation between camera frame and map or robot base. This feature can be turned off in the camera configuration files.
Perception pipelines in RoboSherlock are defined as analysis_engines in the descriptor/analysis_engines folder of any robosherlock package. The core robosherlock package offers an executable called run that we can use to run any of these pipelines. To see how this works, start a roscore and try to run the demo pipeline from robosherlock:
rosrun robosherlock run _ae:=demo
This will initialize active components of RoboSherlock and will wait for data to be published on the camera topics. The executable takes several rosparams as input, one of them being the name of the analysis engine we want to execute. To see more options run with --help option. For now just use the default parameters. To actually process some images we will need some data. Start the bagfile:
rosbag play test.bag --loop
You should see the results of the individual annotators in the visualizer windows (one for the colored image and one for the generated point clouds). If you don’t see a visualizer window try turning visualization on by stopping the node and restarting it with the _vis:=true option (depending on how you started the docker container this might not work, but don’t worry, we have other ways of seeing the results).
Pressing left or right in the point cloud viewer (n or p in the image viewer) will change the view and show results of individual annotators. You should see an output similar to the one below:
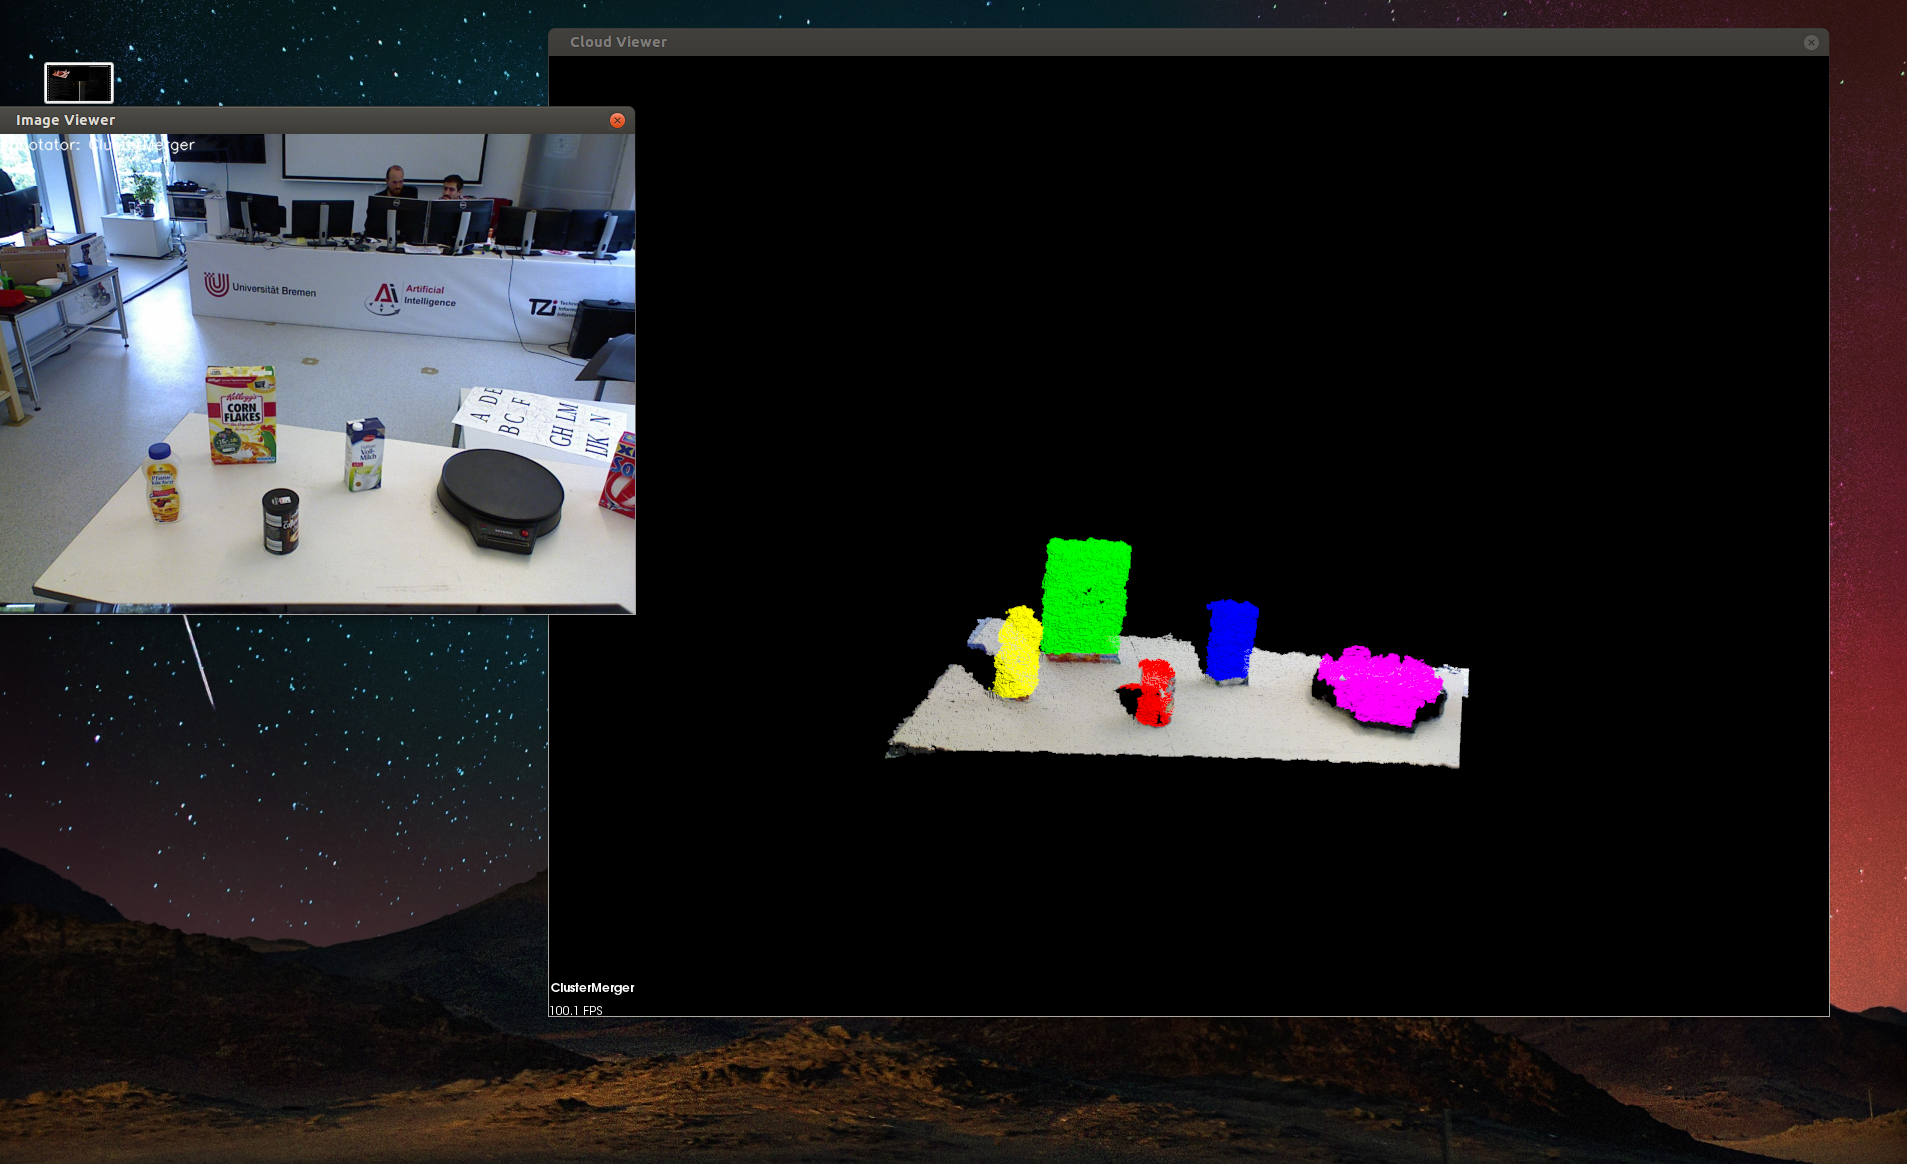
The demo is a very simple example of how perception pipelines are defined and run in RoboSherlock. The definition of the pipeline is located in ./descriptors/analysis_engines/demo.yaml. Contents of it are the following
ae: # -> various meta data
    name: demo
fixedflow: # -> the fixedflow a.k.a the perception algorithms, i/o components etc.
    - CollectionReader
    - ImagePreprocessor
    - PointCloudFilter
    - NormalEstimator
    - PlaneAnnotator
    - ImageSegmentationAnnotator
    - PointCloudClusterExtractor
    - ClusterMerger
CollectionReader: # parameter overrides for annotators
    camera_config_files: ['config_kinect_robot.ini']
Let’s modify this pipeline. For this let’s make a copy of it in rs_tutorial/descriptors/analysis_engines/, and call it my_demo.yaml. Open that file and replace name: demo with name: my_demo.
If run without pipeline planning, the order in the fixed flow is extremely important. Try to add Cluster3DGeometryAnnotator before PlaneAnnotator and run the pipeline. Now add it after the ClusterMerger and relaunch RoboSherlock (no compilation required). You will now have the estimated 3D bounding box with a pose estimate for each cluster (search the output in the terminal for the results). .. If you are running in docker and you don’t have a visualization add DrawResultImage to the end of your pipeline, and restart RoboSherlock. It will save images to the workdir for each processed scene.